- English (USA)
- English (UK)
- English (India)
- English (Canada)
- English (Australia)
- English (Philippines)
- English (Nigeria)
- Deutsch
- Español (España)
- Español (México)
- Français
- Italiano
- Nederlands
- Polski
- Português (Portugal)
- Português (Brasil)
- Русский
- Türkçe
- العربية
- Ελληνικά
- Svenska
- Suomi
- עברית
- 日本語
- 한국어
- 简体中文
- 繁體中文
- Bahasa Indonesia
- Bahasa Melayu
- ไทย
- Tiếng Việt
- हिंदी

Halma PLC (HLMA)
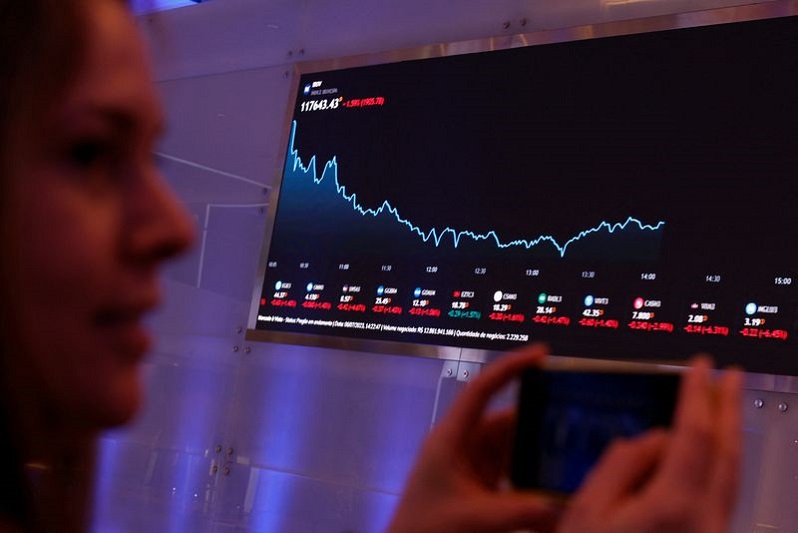
Halma PLC stock price live, this page displays LON HLMA stock exchange data. View the HLMA premarket stock price ahead of the market session or assess the after hours quote. Monitor the latest movements within the Halma PLC real time stock price chart below.
What Is the Halma PLC Stock Price Today?
The Halma PLC stock price today is 3,486.0.
What Is the Stock Symbol for Halma PLC?
The stock symbol for Halma PLC is "HLMA."
What Stock Exchange Does Halma PLC Trade On?
Halma PLC is listed and trades on the London stock exchange.
Is Halma PLC a Good Stock to Buy?
Determining whether Halma PLC—or any stock—is a good buy requires comprehensive analysis. To evaluate its potential, users can sign up to InvestingPro, where they can assess stock price fair value and other essential metrics.
You can find more details by visiting the additional pages to view historical data, charts, latest news, analysis or visit the forum to view opinions on the HLMA quote. (ISIN: GB0004052071)
3,486.0
-44.0(-1.25%)
Real-time Data·
Fair Value
An estimate of a stock's true price based on valuation models like discounted cash flow, peer valuation multiples, and dividend discount models.
Day's Range
3,469.9
3,540.0
52 wk Range
3,192.0
4,902.0
HLMA is not included in our AI-picked strategies. See which stocks are.
Fair Value
An estimate of a stock's true price based on valuation models like discounted cash flow, peer valuation multiples, and dividend discount models.
Day's Range
3,469.93,540.0
52 wk Range
3,192.04,902.0
Key Statistics
Edit
Prev. Close
Open
Volume
Average Volume (3m)
1-Year Change
Fair Value
Fair Value Upside
Market Cap
Shares Outstanding
Revenue
Net Income
EPS
EPS Growth Forecast
Next Earnings Date
(0.69%)
Dividends Payment Streak
P/E Ratio
Return on Assets
Return on Equity
Gross Profit Margin
Price/Book
EBITDA
EV/EBITDA
Beta
Book Value / Share
HLMA Scorecard
Company’s Health
Assesses a company's financial position by analysing its market value, financial ratios, industry benchmarks, and competitors.
UnlockFair Value
An estimate of a stock's true price based on valuation models like discounted cash flow, peer valuation multiples, and dividend discount models.
Unlock PriceTechnical Analysis
Strong Sell
Price Target
4,386.5
Upside
+25.83%
Members' Sentiments
Bearish
Bullish
ProTips
Tips that distill complex financial data into concise, actionable investment insights.
Trading at a high earnings multiple

 Halma receives Investment Bank Analyst Rating Update
- Investing.com
Pro
 Halma receives Investment Bank Analyst Rating Update
- Investing.com
Pro

 Halma receives Investment Bank Analyst Rating Update
- Investing.com
Pro
Technical Analysis
Summary
Strong Sell
Sell
Neutral
Buy
Strong Buy
Strong Sell
Technical Indicators
Strong Sell
Moving Averages
Strong Sell
Analyst Ratings
11 Buy
5 Hold
1 Sell
Ratings:
17 analysts
Overall Consensus
Buy
Analysts 12-Month Price Target:
Average 4,386.5
(+25.83% Upside)
Halma PLC Earnings Call Summary for H2/2026
- Halma reported 14.4% revenue growth and 21% EPS growth, marking 23rd consecutive year of profit increases with EBIT margin up 110bps to 22.7%
- Stock plunged 13.44% in pre-market despite strong results; trades at premium P/E of 44.32 with $20.34B market cap, suggesting valuation concerns
- Photonics business drove 8 percentage points of organic growth; acquisitions contributed 2.5% to revenue and 3.9% to profit expansion
- Currency headwinds from USD depreciation impacted results; all three operating sectors exceeded internal KPI targets with 19% organic EBIT growth
- No specific forward guidance provided; company maintains focus on R&D investment and strategic acquisitions amid currency and market volatility risks
Last Updated: 2026/06/11, 11:00
Read Full TranscriptEarnings
Latest Release
Jun 11, 2026
EPS / Forecast
0,59 / 0,55
Revenue / Forecast
1,34B / 1,29B
Compare HLMA to Peers and Sector
Metrics to compare | HLMA | Sector Sector - Average of metrics from a broad group of related Technology sector companies | Relationship RelationshipHLMAPeersSector | |
|---|---|---|---|---|
P/E Ratio | 35.8x | 21.6x | 12.5x | |
PEG Ratio | 1.40 | 0.04 | 0.01 | |
Price/Book | 6.1x | 1.8x | 2.4x | |
Price / LTM Sales | 5.2x | 0.9x | 2.2x | |
Upside (Analyst Target) | 26.1% | 11.5% | 40.5% | |
Fair Value Upside | Unlock | 5.1% | 9.2% | Unlock |
Halma plc, together with its subsidiaries, provides technology solutions in the safety, health, and environmental markets in the United States, Mainland Europe, the United Kingdom, the Asia Pacific, Africa, the Middle East, and internationally. The company operates in three segments: Safety, Environmental & Analysis, and Healthcare. Its Safety segment provides products that protect people, assets, and infrastructure used in public and commercial spaces and in industrial and logistics operations. This segment serves fire safety, public safety, worker safety, and infrastructure and asset safety markets. The Environmental & Analysis segment offers technologies that monitor the environment used in optical solutions, water analysis and treatment system, and environmental monitoring technologies. Its Healthcare segment provides technologies and digital solutions for healthcare enablement, discovery, prevention, and diagnostics, and therapeutic solutions. The company was incorporated in 1894 and is headquartered in Amersham, the United Kingdom.
Ownership
Ownership Overview
Top Holders
FAQ
What Is the Halma (HLMA) Stock Price Today?
The Halma stock price today is 3 486,0 GBP.
What Stock Exchange Does Halma Trade On?
Halma is listed and trades on the London Stock Exchange.
What Is the Stock Symbol for Halma?
The stock symbol for Halma is "HLMA."
Does Halma Pay Dividends? What’s The Current Dividend Yield?
The Halma dividend yield is 0.69%.
What Is the Halma Market Cap?
As of today, Halma market cap is 13,17B GBP.
What Is Halma's Earnings Per Share (TTM)?
The Halma EPS (TTM) is 1,0.
When Is the Next Halma Earnings Date?
Halma will release its next earnings report on Nov 19, 2026.
From a Technical Analysis Perspective, Is HLMA a Buy or Sell?
Based on moving averages and other technical indicators, the daily buy/sell signal is Strong Sell.
How Many Times Has Halma Stock Split?
Halma has split 4 times.
How Many Employees Does Halma Have?
Halma has 9000 employees.
What is the current trading status of Halma (HLMA)?
As of Jul 29, 2026, Halma (HLMA) is trading at a price of 3 486,0 GBP, with a previous close of 3 530,0 GBP. The stock has fluctuated within a day range of 3 469,9 GBP to 3 540,0 GBP, while its 52-week range spans from 3 192,0 GBP to 4 902,0 GBP.
What Is Halma (HLMA) Price Target According to Analysts?
The average 12-month price target for Halma is 4 386,5 GBP, with a high estimate of 5010 GBP and a low estimate of 3050 GBP. 11 analysts recommend buying the stock, while 1 suggest selling, leading to an overall rating of Buy. The stock has an +25,83% Upside potential.
Risk Disclosure: Trading in financial instruments and/or cryptocurrencies involves high risks including the risk of losing some, or all, of your investment amount, and may not be suitable for all investors. Prices of cryptocurrencies are extremely volatile and may be affected by external factors such as financial, regulatory or political events. Trading on margin increases the financial risks.
Before deciding to trade in financial instrument or cryptocurrencies you should be fully informed of the risks and costs associated with trading the financial markets, carefully consider your investment objectives, level of experience, and risk appetite, and seek professional advice where needed.
Fusion Media would like to remind you that the data contained in this website is not necessarily real-time nor accurate. The data and prices on the website are not necessarily provided by any market or exchange, but may be provided by market makers, and so prices may not be accurate and may differ from the actual price at any given market, meaning prices are indicative and not appropriate for trading purposes. Fusion Media and any provider of the data contained in this website will not accept liability for any loss or damage as a result of your trading, or your reliance on the information contained within this website.
It is prohibited to use, store, reproduce, display, modify, transmit or distribute the data contained in this website without the explicit prior written permission of Fusion Media and/or the data provider. All intellectual property rights are reserved by the providers and/or the exchange providing the data contained in this website.
Fusion Media may be compensated by the advertisers that appear on the website, based on your interaction with the advertisements or advertisers.
© 2007-2026 - Fusion Media Limited. All Rights Reserved.