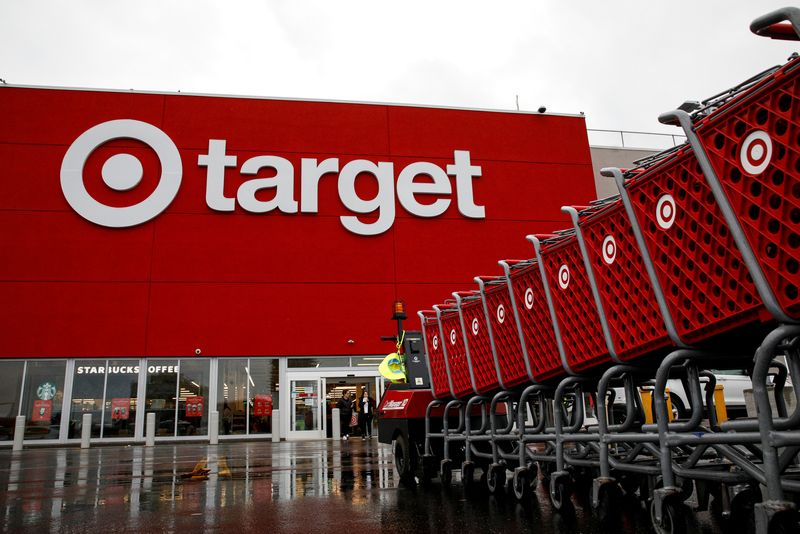
Target Corporation (TGT)

Currency in USD
115.75
-3.03(-2.55%)
Closed·
115.90+0.15(+0.13%)
·
TGT is not included in our AI-picked strategies. See which stocks are.
Fair Value
Day's Range
115.19117.91
52 wk Range
83.44126.00
Key Statistics
Prev. Close
118.78
Open
117.43
Day's Range
115.19-117.91
52 wk Range
83.44-126
Volume
5.03M
Average Volume (3m)
6.73M
1-Year Change
7.8952%
Book Value / Share
35.7
Fair Value
unlockUnlock
Fair Value Upside
unlockUnlock
TGT Scorecardpro icon
Company’s Health
Unlock
Fair Value
Unlock Price
Fair Price
Upside
Price Target
124.88
Upside
+7.88%
Members' Sentiments
Bearish
Bullish
ProTips
18 analysts have revised their earnings downwards for the upcoming period

Target Corporation News & Analysis

Show more

Technical Analysis

Summary
Strong Sell
Sell
Neutral
Buy
Strong Buy
Strong Sell
Technical Indicators
Strong Sell
Moving Averages
Strong Sell

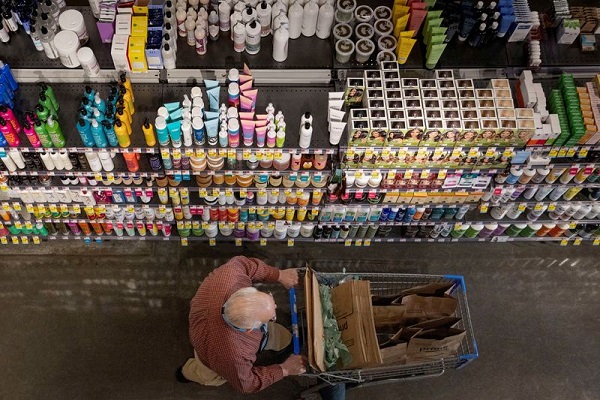
Target Corporation operates as a general merchandise retailer in the United States. It offers apparel for women, men, young adults, kids, toddlers, and babies, as well as jewelry, accessories, and shoes; and beauty products, such as skin and bath care, cosmetics, hair care, oral care, deodorant, and shaving products. The company also provides food and beverage products comprising dry and perishable grocery, including snacks, candy, beverages, deli, bakery, meat, produce, and food service; electronics which includes video games and consoles, toys, sporting goods, entertainment, and luggage; bed and bath, home décor, school/office supplies, storage, small appliances, kitchenware, greeting cards, party supplies, furniture, lighting, home improvement, and seasonal merchandise; and household essentials, such as household cleaning, paper products, over-the-counter healthcare, vitamins and supplements, baby gear, and pet supplies. In addition, it sells merchandise through periodic design and creative partnerships, and shop-in-shop experience; and in-store amenities. The company sells its products through its stores; and digital channels, including Target.com. Target Corporation was incorporated in 1902 and is headquartered in Minneapolis, Minnesota.

Employees
440000

Target Corporation SWOT Analysis


Retail Crossroads
Target navigates shifting consumer behavior, digital competition, and economic uncertainties while maintaining its position as a leading discount retaile
Strategic Initiatives
Explore Target's efforts in inventory management, style focus, digital investments, and AI integration to address challenges and position for future growth
Competitive Dynamics
Delve into Target's battle against Walmart, Amazon, and others, highlighting its unique strengths and vulnerabilities in the fiercely competitive retail landscape
Financial Outlook
Analysts project cautious growth with an average price target of $104, reflecting mixed views on Target's ability to overcome margin pressures and market share losses
Read full SWOT analysis

Target Corporation Earnings Call Summary for Q4/2026

  • Target Q4 2026 EPS of $2.44 beat forecasts by 13.49%; revenue reached $30.5B, slightly above $30.46B estimate
  • Stock surged 2.15% in pre-market to $115.6, following 8.93% gain from previous close on strong earnings performance
  • CEO Cornell cited digital and merchandising transformation as key drivers; cost controls and productivity improved margins
  • Non-recurring transformation costs of ~$90M in Q4 continue to pressure short-term profitability alongside tariff headwinds
  • Company maintains focus on operational efficiencies and digital expansion to drive future growth amid competitive retail pressures
Last Updated: 2026/03/03, 20:44
Read Full Transcript

Compare TGT to Peers and Sector

Metrics to compare
TGT
Peers
Sector
Relationship
P/E Ratio
14.5x15.2x12.1x
PEG Ratio
−1.761.600.03
Price/Book
3.3x2.0x1.5x
Price / LTM Sales
0.5x0.3x0.9x
Upside (Analyst Target)
5.2%0.0%23.1%
Fair Value Upside
Unlock−1.1%12.5%Unlock

Analyst Ratings

11 Buy
24 Hold
3 Sell
Ratings:
38 analysts
Overall Consensus
Neutral

Analysts 12-Month Price Target:

Average 124.88
(+7.88% Upside)
Firm
ArticlePositionPrice TargetUpside / DownsideFrom Price TargetActionDate
Guggenheim
Buy130.00+12.31%-MaintainMar 11, 2026
DA Davidson
Buy140.00+20.95%120.00MaintainMar 09, 2026
JPMorgan
Hold120.00+3.67%115.00MaintainMar 05, 2026
Mizuho
Hold120.00+3.67%100.00MaintainMar 05, 2026
Evercore ISI
Hold120.00+3.67%105.00MaintainMar 05, 2026

Dividends

Payout Ratio
Payout ratio (TTM)
Earnings retained
EPS 8.13%
Dividend Yield
3.94%
Industry Median 1.48%
Annualised payout
4.56
Paid quarterly
5-Years Growth
+11.02%
Growth Streak

Earnings

Latest Release
Mar 03, 2026
EPS / Forecast
2.44 / 2.15
Revenue / Forecast
30.50B / 30.46B
EPS Revisions
Last 90 days

TGT Income Statement

FAQ

What Is the Target (TGT) Stock Price Today?

The Target stock price today is 115,75 USD.

What Stock Exchange Does Target Trade On?

Target is listed and trades on the New York Stock Exchange.

What Is the Stock Symbol for Target?

The stock symbol for Target is "TGT."

Does Target Pay Dividends? What’s The Current Dividend Yield?

The Target dividend yield is 3.94%.

What Is the Target Market Cap?

As of today, Target market cap is 52,68B USD.

What Is Target's Earnings Per Share (TTM)?

The Target EPS (TTM) is 8,13.

When Is the Next Target Earnings Date?

Target will release its next earnings report on May 20, 2026.

From a Technical Analysis Perspective, Is TGT a Buy or Sell?

Based on moving averages and other technical indicators, the daily buy/sell signal is Neutral.

How Many Times Has Target Stock Split?

Target has split 5 times.

How Many Employees Does Target Have?

Target has 440000 employees.

What is the current trading status of Target (TGT)?

As of Mar 12, 2026, Target (TGT) is trading at a price of 115,75 USD, with a previous close of 118,78 USD. The stock has fluctuated within a day range of 115,19 USD to 117,91 USD, while its 52-week range spans from 83,44 USD to 126,00 USD.

What Is Target (TGT) Price Target According to Analysts?

The average 12-month price target for Target is 124,88 USD, with a high estimate of 160 USD and a low estimate of 88 USD. 11 analysts recommend buying the stock, while 3 suggest selling, leading to an overall rating of Neutral. The stock has an +7,88% Upside potential.

What Is the TGT Premarket Price?

TGT's last pre-market stock price is 118,04 USD. The pre-market share volume is 3 720,00, and the stock has decreased by -0,74, or -0,62%.

What Is the TGT After Hours Price?

TGT's last after hours stock price is 115,90 USD, the stock has decreased by 0,15, or 0,13%.
Risk Disclosure: Trading in financial instruments and/or cryptocurrencies involves high risks including the risk of losing some, or all, of your investment amount, and may not be suitable for all investors. Prices of cryptocurrencies are extremely volatile and may be affected by external factors such as financial, regulatory or political events. Trading on margin increases the financial risks.
Before deciding to trade in financial instrument or cryptocurrencies you should be fully informed of the risks and costs associated with trading the financial markets, carefully consider your investment objectives, level of experience, and risk appetite, and seek professional advice where needed.
Fusion Media would like to remind you that the data contained in this website is not necessarily real-time nor accurate. The data and prices on the website are not necessarily provided by any market or exchange, but may be provided by market makers, and so prices may not be accurate and may differ from the actual price at any given market, meaning prices are indicative and not appropriate for trading purposes. Fusion Media and any provider of the data contained in this website will not accept liability for any loss or damage as a result of your trading, or your reliance on the information contained within this website.
It is prohibited to use, store, reproduce, display, modify, transmit or distribute the data contained in this website without the explicit prior written permission of Fusion Media and/or the data provider. All intellectual property rights are reserved by the providers and/or the exchange providing the data contained in this website.
Fusion Media may be compensated by the advertisers that appear on the website, based on your interaction with the advertisements or advertisers.
© 2007-2026 - Fusion Media Limited. All Rights Reserved.